
Explanation:
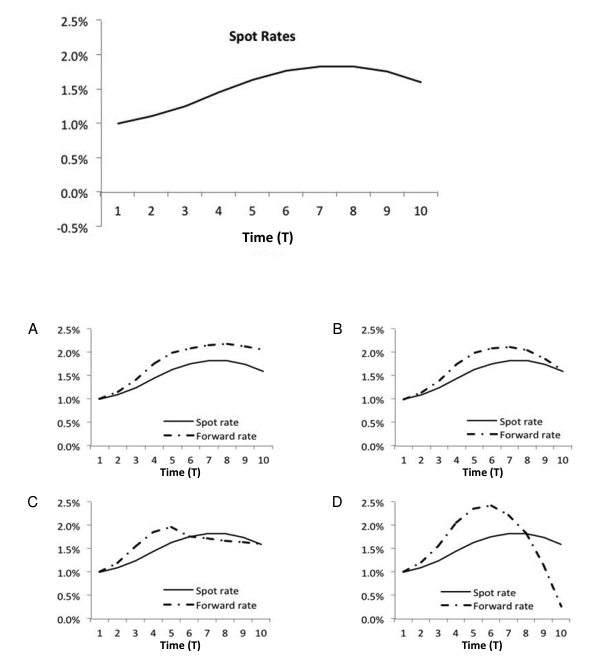
D is correct. Where the term structure of spot rates is upward(downward)-sloping, forward rates for a period starting at time T are greater(less) than the spot rate for maturity T. Therefore, the forward curve will be above the spot curve when the spot curve is rising and below the spot curve when the spot curve is declining. The only chart that reflects these conditions is choice D. A, B, and C are incorrect per the explanation for D above.
Ultimate access to all questions.
An analyst at a fixed-income investment fund is constructing the risk-free forward rate curve. Given the observed term structure of risk-free spot rates, which of the following charts correctly depicts the 1‑year forward rate curve beginning at time t?
A
See the chart in the image
B
See the chart in the image
C
See the chart in the image
D
See the chart in the image