
Explanation:
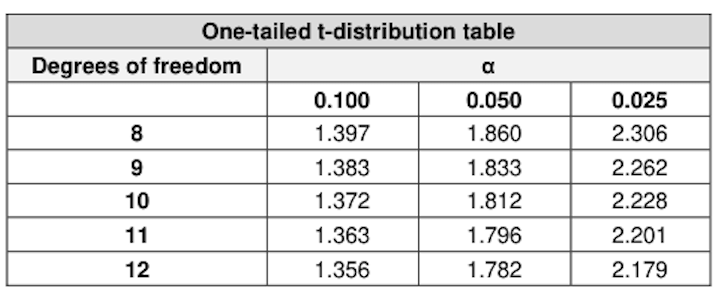
The correct answer is A. The confidence interval is calculated using the formula: mean ± t-statistic * standard error. For a 95% confidence interval, the t-statistic is derived from the t-distribution table corresponding to the degrees of freedom and the desired confidence level. In this case, the degrees of freedom are 11 (since there are 12 sample observations minus 1), and the t-statistic for a 95% confidence interval with 11 degrees of freedom is 2.201 from the 0.025 column of the t-table. The mean monthly return is -0.75%, and the standard error is 2.70%. Thus, the 95% confidence interval is calculated as:
This interval represents the range within which the true mean monthly return of stock XYZ is likely to fall with 95% confidence. The other options (B, C, and D) use incorrect t-statistics from the table, which is why they are incorrect.
Ultimate access to all questions.
A financial analyst is tasked with forecasting the potential returns for stock XYZ in the upcoming month. To facilitate this, the analyst has reviewed the returns from the past 12 months and determined that the average monthly return of the stock is -0.75%, with a standard error of 2.70%.
Refer to the one-tailed t-distribution table provided below:
Using the t-table, calculate the 95% confidence interval for the average return of stock XYZ.
A
-6.69% and 5.19%
B
-6.63% and 5.13%
C
-5.60% and 4.10%
D
-5.56% and 4.06%