
Explanation:
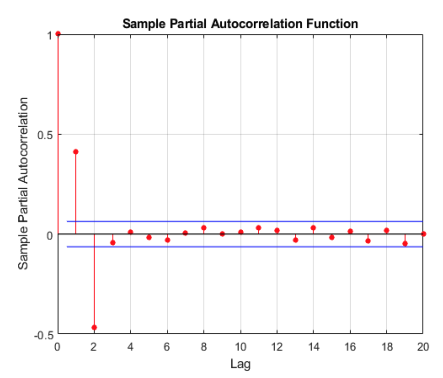
The PACF plot provided in the file content shows a significant spike at lag 1 and lag 2, and then it cuts off after the second lag. This pattern suggests that the security's time series data exhibits a second-order autoregressive (AR(2)) process. In an AR(2) model, the current value of the time series is a linear combination of the two previous values, plus a random error term. The cut-off in the PACF after the second lag indicates that there is no autocorrelation beyond the second lag, which is a characteristic of an AR(2) model. Therefore, the best regression approach for the security, based on the provided PACF plot, is an AR(2) model. This approach will allow the market risk manager to analyze and forecast the security's performance more accurately by accounting for the specific autocorrelation structure present in the data.
Ultimate access to all questions.
No comments yet.
A
AR(1)
B
MA(1)
C
AR(2)
D
MA(2)