
Explanation:
The correct answer to the question is A, which is a 95% confidence interval for the mean return of stock XYZ ranging from -6.69% to 5.19%. To determine this interval, we use the formula for a confidence interval, which is the sample mean plus or minus the t-statistic multiplied by the standard error. In this case, the sample mean monthly return is -0.75%, and the standard error is 2.70%.
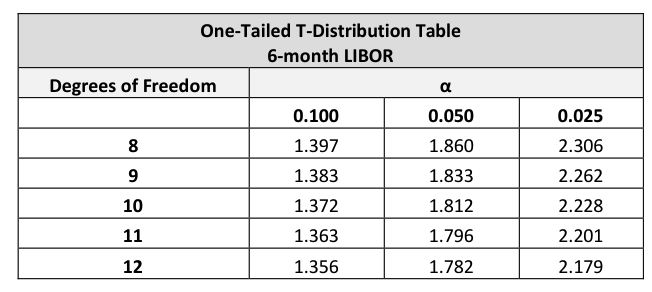
Since we are looking for a 95% confidence interval, we need to find the t-statistic that corresponds to the 0.025 level in a one-tailed test, because we are looking at the interval in both directions from the mean (two-tailed interval). The degrees of freedom (df) are determined by the number of sample observations minus 1, which is 11 in this scenario. From the t-distribution table provided, the t-statistic for 11 degrees of freedom at the 0.025 level is 2.201.
The calculation for the confidence interval is as follows: Lower limit = -0.75% - (2.201 * 2.70%) Upper limit = -0.75% + (2.201 * 2.70%)
Performing the multiplication: Lower limit = -0.75% - 5.943% Upper limit = -0.75% + 5.943%
Converting these to percentages: Lower limit = -6.69% Upper limit = 5.19%
Thus, the 95% confidence interval for the mean return is from -6.69% to 5.19%, confirming that option A is the correct answer. This interval indicates that we can be 95% confident that the true mean monthly return of stock XYZ lies within this range.
An analyst has analyzed the performance of stock XYZ over a 12-month period and found that the average monthly return is -0.75%, with a standard error of 2.70%. Using a one-tailed t-distribution, the analyst needs to determine the 95% confidence interval for the mean monthly return. Use the provided t-distribution table to calculate this interval.
A
-6.69% and 5.19%
B
-6.63% and 5.15%
C
-5.60% and 4.10%
D
-5.56% and 4.06%
No comments yet.