
Explanation:
The correct answer to the question is D, and the explanation is as follows:
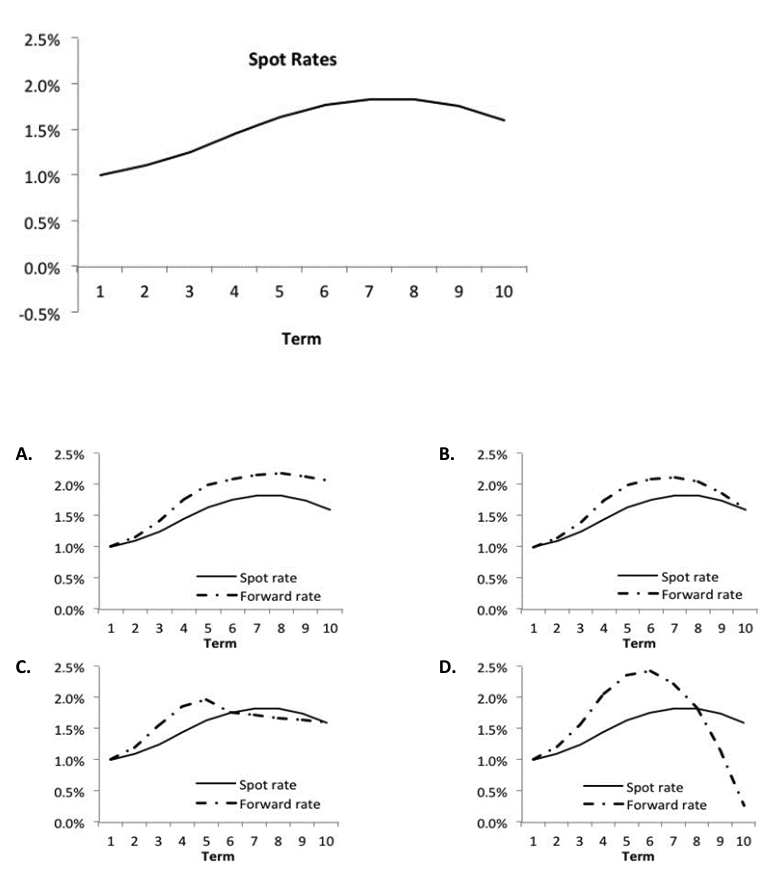
The forward rate curve is derived from the spot rate curve and represents the market's expectations for future interest rates. The relationship between the spot rate curve and the forward rate curve can be understood through three key conditions:
When the spot curve is rising: The forward curve will be positioned above the spot curve. This indicates that market participants expect interest rates to increase in the future compared to the current spot rates.
Spot curve reaches its maximum: The forward curve will cross the spot curve at the point where the spot curve reaches its maximum value. This crossing point signifies that the market anticipates a change in the direction of interest rates from increasing to decreasing.
When the spot curve is declining: The forward curve will be below the spot curve, suggesting that market participants expect interest rates to decrease in the future compared to the current spot rates.
In the provided chart options, only option D correctly reflects these three conditions, showing the forward curve above the spot curve where the spot curve is rising, crossing it at the maximum point, and being below it where the spot curve is declining. This understanding is crucial for financial professionals as it helps in making informed investment decisions and risk management strategies based on interest rate expectations.
Ultimate access to all questions.
The forward rate curve can be derived from the yield curve and offers insight into market expectations of future interest rates. Given this, analyze the following options and identify the graph that accurately represents the derived forward rate curve.
A
Graph A
B
Graph B
C
Graph C
D
Graph D