
Explanation:
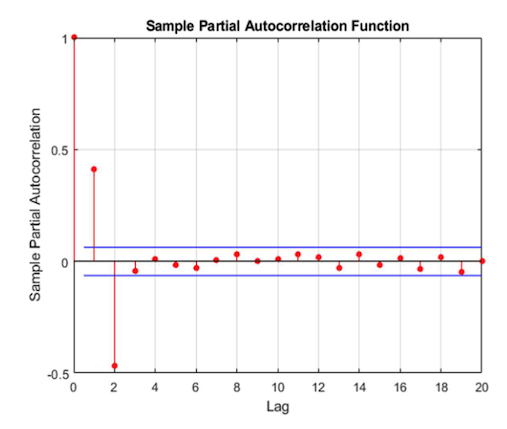
The PACF plot provided in the file content shows a significant spike at the first and second lags, and then it cuts off after the second lag. This pattern suggests that the security's time series data exhibits autocorrelation that can be modeled using an autoregressive process of order 2, which is denoted as AR(2). The significant spike at the first lag indicates that the first lag is a significant predictor of the current value, and the significant spike at the second lag indicates that the second lag is also a significant predictor. However, the fact that the PACF plot cuts off after the second lag implies that lags beyond the second do not provide additional predictive power. Therefore, the best regression approach for modeling the security's performance, based on the given PACF plot, is an AR(2) model.
Ultimate access to all questions.
An individual tasked with managing market risk is focused on analyzing and forecasting the movements of a specific security. They have obtained historical time series data for this security and seek input from a colleague in the quantitative analysis team. The colleague provides a graph illustrating the Partial Autocorrelation Function (PACF) for the data:
Based on the given PACF graph, which regression method would be most appropriate for analyzing the security?
A
AR(1)
B
MA(1)
C
AR(2)
D
MA(2)