
Explanation:
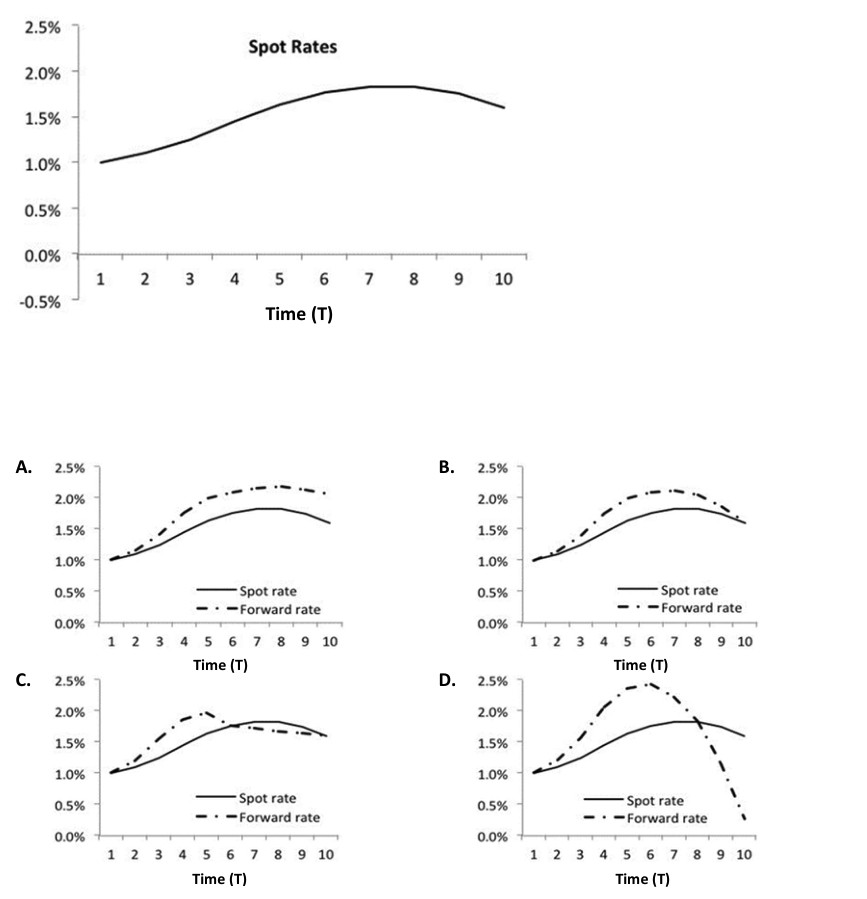
The correct answer to the question is option D. The explanation for this is based on the relationship between the term structure of spot rates and the forward rate curve. When the term structure of spot rates is upward-sloping, it indicates that the interest rates are increasing as the maturity period extends. In such a scenario, the forward rates for a period starting at time T will be greater than the spot rate for maturity T. Conversely, when the term structure is downward-sloping, the forward rates will be less than the spot rate for maturity T.
In the given file content, the spot rate curve is shown to be upward-sloping, with rates starting from 0.5% and increasing to 2.5% as time (T) progresses. Therefore, the forward rate curve should be above the spot rate curve for times when the spot curve is rising. Option D is the only chart that correctly reflects this condition, showing the forward rate curve above the spot rate curve where the spot curve is rising, and below it where the spot curve is declining. This is in line with the principles of interest rate behavior as explained in the reference provided by the Global Association of Risk Professionals in their book "Valuation and Risk Models".
Ultimate access to all questions.
A financial analyst working for a fixed-income investment fund is constructing the risk-free forward rate curve. The analyst has observed the term structure of risk-free spot rates, presented below:
Based on the given term structure of risk-free spot rates, which one of the accompanying charts accurately depicts the 1-year forward rate curve commencing at each respective time T?
A
Graph A
B
Graph B
C
Graph C
D
Graph D