
Explanation:
The correct answer is A: X2+Y2. This is because adding the synthetic feature X2+Y2 allows the classifier to take into account the distance of each data point from the origin, forming a circular boundary that effectively separates the classes. This feature corresponds to the equation of a circle, which is appropriate for the given data distribution.
Ultimate access to all questions.
You are provided with a dataset visualized in the graphic below, where each data point has two dimensions, X and Y. The shade of each dot signifies its class membership. To improve the classification accuracy of this data using a linear algorithm, it is necessary to introduce an additional synthetic feature. What should be the value of this synthetic feature?
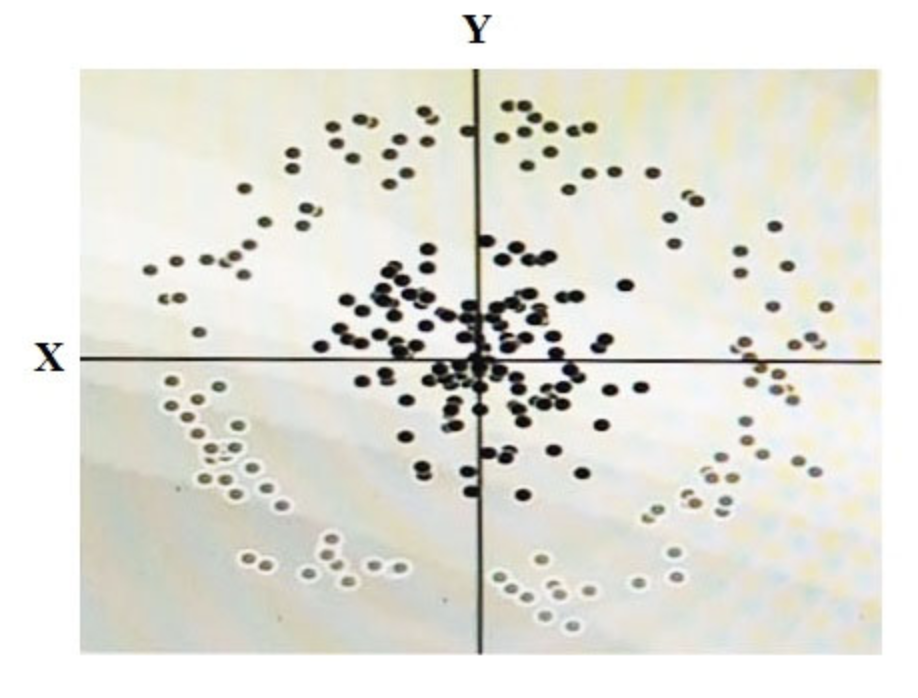
A
X2+Y2
B
X2
C
Y2
D
cos(X)
No comments yet.