
Explanation:
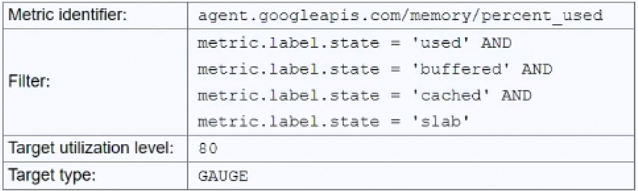
The issue with the current autoscaling configuration is that the filter uses multiple AND conditions (metric.label.state = 'used' AND 'buffered' AND 'cached' AND 'slab'), which is logically impossible since a memory metric can only have one state at a time. This prevents the autoscaler from detecting any metrics and triggering scaling. Option C correctly addresses this by changing the filter to focus only on the 'used' memory state, which aligns with the goal of scaling when total memory usage exceeds 80%. The community discussion, including upvoted comments and references to Google documentation, strongly supports C as the correct solution. Other options are less suitable: A (DELTA_PER_MINUTE) is irrelevant to the filter issue, B (changing the metric identifier) doesn't fix the logical filter problem, and D (using 'free' memory with a 20% target) is an indirect approach that doesn't directly match the requirement of scaling on used memory exceeding 80%.
Ultimate access to all questions.
You have a Compute Engine application configured to autoscale when total memory usage exceeds 80%. Although you have installed the Cloud Monitoring agent and configured an autoscaling policy, the application fails to scale under high load. What should you do to resolve this?
A
Change the Target type to DELTA_PER_MINUTE.
B
Change the Metric identifier to agent.googleapis.com/memory/bytes_used.
C
Change the filter to metric.label.state = ‘used’.
D
Change the filter to metric.label.state = ‘free’ and the Target utilization to 20.
No comments yet.