
Explanation:
The question asks which of the four distributions (A, B, C, D) has the highest variance, given that all random variables are supported on [-10, 10] and we're looking at their CDFs with the mean marked by the vertical dotted line.
Variance measures spread around the mean. For variables restricted to the same interval [-10, 10], the distribution with the highest variance is the one that puts as much probability mass as possible at the extreme ends (−10 and +10).
Let's quickly characterize each graph:
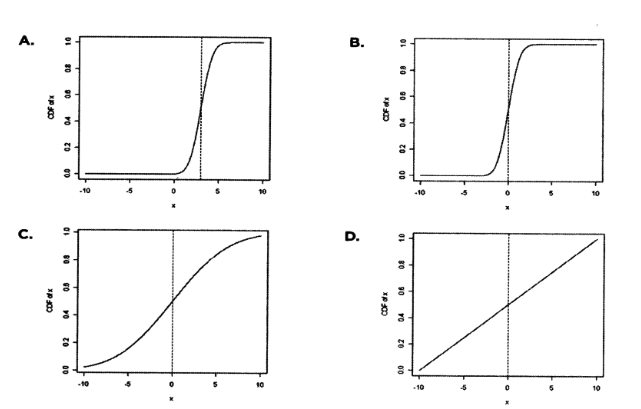
A: Very sharp S-shaped CDF, almost all the rise happens in a very narrow region around the mean (≈ 0 to ≈ 3).
→ Very concentrated around the mean → low variance
B: Still quite steep / sigmoidal, but noticeably wider than A (rise starts clearly left of 0 and finishes right of 0).
→ More spread out than A → moderate variance
C: Much flatter S-curve. It starts rising noticeably before x = −5, reaches ≈ 0.5 near x = 0, and continues rising significantly past x = 5.
→ Much more spread out → high variance
D: Perfectly straight line from (−10, 0.2) to (10, 0.8) → this is (essentially) a uniform distribution on roughly [−10, 10] (possibly shifted/truncated slightly at the ends, but very close to Uniform[−10, 10]).
→ Maximum possible spread within the interval → highest variance
D > C > B > A
Among all distributions supported on [a, b], the maximum possible variance is achieved by the two-point distribution that puts 50% mass at a and 50% mass at b (variance = (b−a)²/4).
The uniform distribution on [a, b] has variance (b−a)²/12 ≈ 0.083(b−a)², which is the second highest among all continuous distributions — and very close to the theoretical maximum.
Graph D is (very nearly) uniform on [−10, 10], while the others are visibly more concentrated toward the center → D has the largest spread → highest variance.
Answer: D
No comments yet.
The following graphs show the cumulative distribution function (CDF) of four different random variables. The dotted vertical line indicates the mean of the distribution. Assuming each random variable can only be values between -10 and 10, which distribution has the highest variance?
A
Graph A
B
Graph B
C
Graph C
D
Graph D