
Explanation:
To determine the correct forward rate curve, we need to apply the mathematical relationship between spot rates and forward rates.
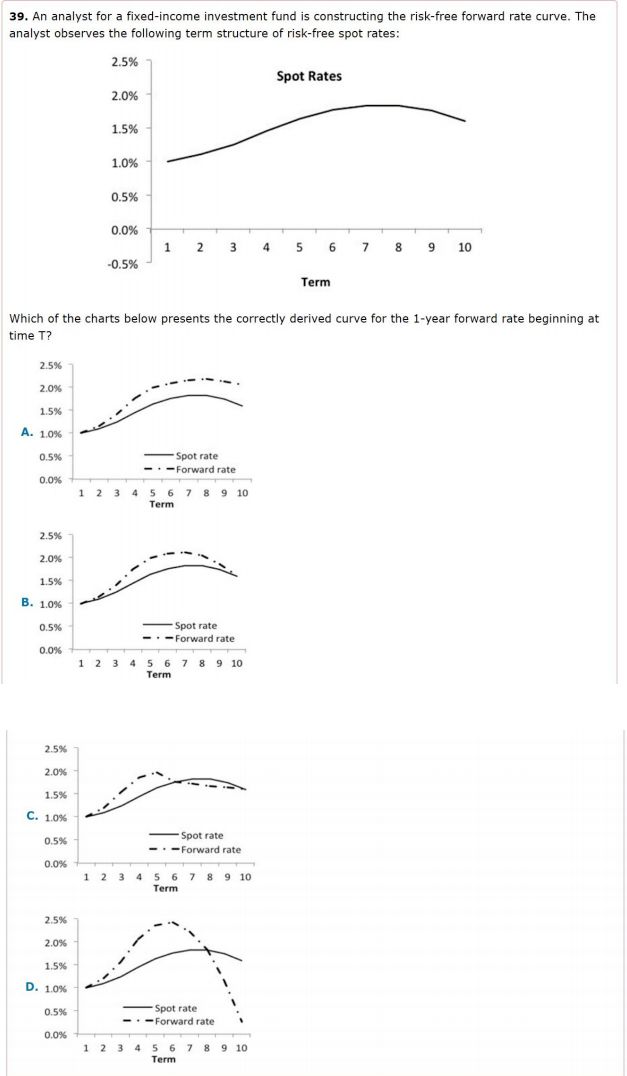
The correct answer is C.
The forward rate represents the "marginal" rate for a specific future period. There are three mathematical rules that govern the relationship between the spot rate curve () and the forward rate curve ():
In the original chart, the spot rate curve:
Option A: Shows the forward rate curve always remaining above the spot rate curve. This would only be true if the spot rate never stopped rising. (Incorrect)
Option B: Shows the forward rate curve staying above the spot rate even as the spot rate begins to decline at the end. (Incorrect)
Option C: * Upward Slope: The forward rate is above the spot rate while the spot curve rises.
The Intersection: The forward rate curve crosses the spot rate curve at the exact point where the spot rate is at its maximum (around Year 8).
Downward Slope: Once the spot rate starts falling, the forward rate drops below it.
This matches the mathematical requirements perfectly. (Correct)
Option D: Shows an extreme drop in the forward rate that does not proportionally match the mild decline in the spot rate shown in the original data. (Incorrect)
An analyst for a fixed-income investment fund is constructing the risk-free forward rate curve. The analyst observes the following term structure of risk-free spot rates. Which of the charts below presents the correctly derived curve for the 1-year forward rate beginning at time T?
A
Chart A
B
Chart B
C
Chart C
D
Chart D